Rainfall and Flooding Terminology

In order to understand why flooding is increasing and how flood risk can be minimized, it is helpful to understand common terminology and concepts related to the severity of rain events, managing storm water runoff and other concepts related to rainfall and flooding.
Understanding the Severity of Rain Events
There are many ways to describe the severity of rainstorms. You’ve likely heard large storms described as a 100-year storm or even a 1,000-year storm. But what do these terms actually mean?
The severity of a particular rain event depends on the intensity of the rain and the duration that the rain falls. Rain that fell at a rate of 1 inch per hour for an hour would not be an unusual event in Montgomery County, while rain falling at the same intensity (1 inch per hour) for 12 hours would be an extremely rare (and likely very damaging) event.
For a particular area, historical rainfall data can be used to determine the expected statistical frequency that rain of specific intensity and duration will occur (e.g., rain falling at a rate of 1 inch per hour for one hour). This information, known as an intensity-duration-frequency (IDF) curve, can help engineers, emergency managers, and others more effectively design stormwater management systems, prepare for emergency response operations, and engage in other flood-related activities.
Frequency can also be thought of as the probability or likelihood that a specific rain event will recur over time. Scientists use the terms return period or recurrence interval to describe, on average, how often an event is expected to occur. For example, a “10-year storm” is statistically expected to occur on average every 10 years, and therefore has a 1 in 10, or 10% chance of occurring in any given year. A “100-year storm” is statistically expected to occur on average every 100 years, and therefore has a 1 in 100, or 1% chance of occurring in any given year.
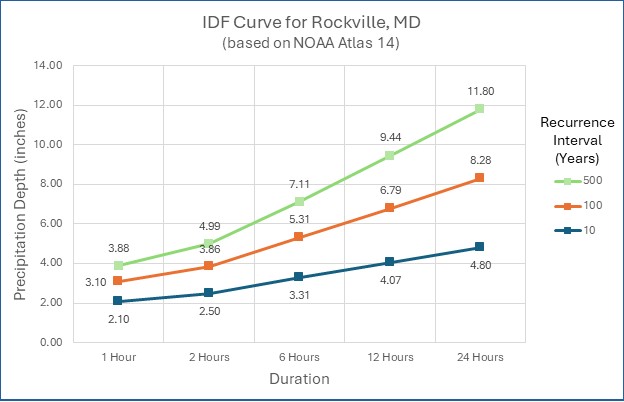
IDF curves produced by the National Oceanic and Atmospheric Administration (NOAA) provide the data used in many stormwater and flood management activities. However, the latest published set of IDF curves, known as Atlas 14, are based on rainfall data through the year 2000.
A set of simplified IDF curves for Rockville, based on Atlas 14 is shown below. As shown on this graphic, according to Atlas 14, the expected rainfall over a one-hour period for a storm with a recurrence interval of 100 years would be 3.1 inches and the expected rainfall over a 24-hour period would be 8.28 inches.
It is important to understand that it is possible for a “100-year storm” to occur more frequently than every 100 years. To understand this, consider the flipping of a coin, which has two possible outcomes – heads or tails. Statistically, the probability of each occurring would be 50%. However, it’s possible that a flipped coin could come up heads twice (or more) in a row. The more times the coin is flipped, the total number of times it came up heads would come closer to 50%.
Similarly, statistical analysis of historical rain gauge data through 2000 suggests that a storm that results in precipitation of 8.28 inches over 24 hours would occur every 100 years. However, just like the flipping of a coin, the actual time between storms of this magnitude could be shorter (or longer). As an example, Ellicott City, MD, experienced storms in 2016 and 2018 that were each considered “1,000-year storms” based on historical rain gauge data.
The Effect of Climate Change on Precipitation
Climate change is affecting precipitation patterns and rates. According to the National Aeronautics and Space Administration (NASA):
Current climate models indicate that rising temperatures will intensify the Earth’s water cycle, increasing evaporation. Increased evaporation will result in more frequent and intense storms, but will also contribute to drying over some land areas. As a result, storm-affected areas are likely to experience increases in precipitation and increased risk of flooding, while areas located far away from storm tracks are likely to experience less precipitation and increased risk of drought.
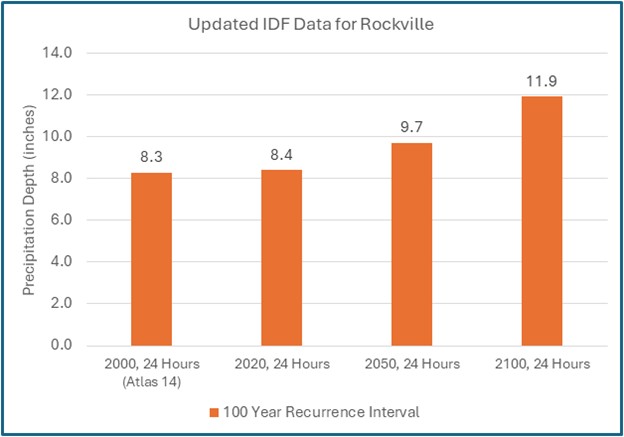
As part of the flood planning process, the County updated IDF data using the process used by NOAA, along with updated rain gauge data and models that predict the impact of climate change on precipitation. This analysis, details of which can be found in the Climate Projections and Analysis Technical Memorandum (PDF), resulted in the development of revised IDF curves that show expected rainfall in 2020, 2050, and 2100 for rain events with a return period or recurrence interval ranging from 10 years to 500 years. The 2050 and 2100 planning horizons were selected to reflect the likely service life of infrastructure assets, which typically range from 20 to 30 years for electrical and mechanical systems (e.g., motors, pumps, HVAC systems) to 50 to 100 years for structural systems, such as buildings, or below ground utilities such as concrete storm drains.
As an example, the updated IDF data for Rockville that is being used in the County’s flood planning process is shown below. This chart shows the expected rainfall that would occur over 24 hours for a storm with a recurrence interval of 100 years. For detailed information on how this data was derived, see the Climate Projections and Analysis Technical Memorandum (PDF).