
Using the Flood Risk Explorer
This page provides instructions on how to use the Flood Risk Explorer. You can also watch this short instructional video to learn about the Flood Risk Explorer.
Before using the Flood Risk Explorer, users will be prompted to agree to the following Terms and Conditions:
- The flood risk maps provided by Montgomery County, Maryland, are intended for informational purposes only. These maps are designed to offer a general overview of flood risk areas within Montgomery County, Maryland based on the best available data at the time of publication.
- Due to natural conditions or human-induced factors, the flood risk for any area is subject to change at any time. Montgomery County, Maryland periodically updates these maps, however, this is not a real time tool and should not be relied upon as such.
- These maps are intended to serve as a general guide for understanding flood risk areas. They are not a substitute for professional advice or official floodplain determinations.
- Users are encouraged to consult with qualified professionals or official sources (such as the Federal Emergency Management Agency (FEMA) flood maps) for specific advice or actions related to flood risk.
- This tool should not be used as the sole basis for making decisions regarding property purchases, development, or any other activities that may be affected by flood risk. Montgomery County, its officials, employees, and agents disclaim any liability for any damages or losses resulting from the use or reliance on the flood risk maps. Users assume all risks associated with the use of these maps.
- By accessing and using the flood risk maps, users acknowledge and agree to foregoing terms and conditions.
Users of the Flood Risk Explorer should also be aware that the County currently regulates development in FEMA floodplains and other areas that may be subject to flooding. The Flood Risk Explorer is only intended to show areas with higher potential flood risk during certain storm events and should not be used to identify areas where regulatory requirements apply. For full information on applicable regulations in FEMA floodplains, as well as other areas of the County, see the Floodplain District Permits information on the Department of Permitting Services website.
User Instructions
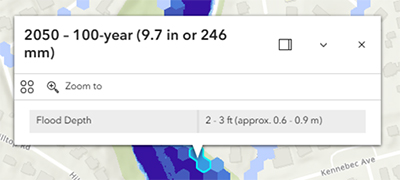
- Select the flood model scenario for viewing using the Flood Scenario Selection menu. The 2020 100-year event is selected by default.
Flood Scenarios
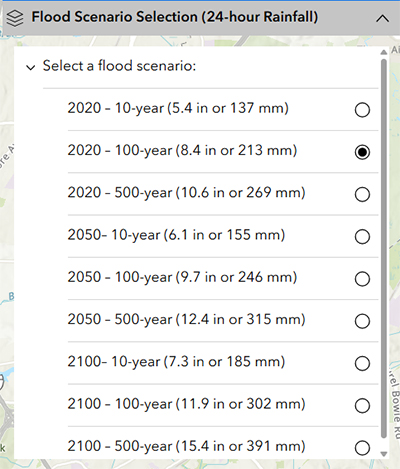
A flood scenario is basically a what-if situation used to imagine or model how flooding would happen under certain conditions. In this tool the scenario options are defined by the year modeled (2020, 2050, 2100) and the type of storm (10-year, 100-year or 500 year).
Amount of Rainfall
The rainfall amounts (given in inches and millimeters in 24-hours for each scenario) are provided as hypothetical storm events of a given frequency interval and duration. For example, for the scenario 2020 – 10-year storm, it is estimated that the storm poured 5.4 inches or 137.2 millimeters of rain in 24-hours.
What is a 10-year, 100-year, 500-year flood?
When people say “10-year storm,” “100-year storm,” or “500-year storm,” they are referring to the likelihood of a specific storm in any given year. A 10-year storm event has a 10% chance of occurring in a calendar year. A 100-year storm event has a 1% chance of occurring in a calendar year. It is possible for multiple, large storm events to occur in a single calendar year. Another way to think about it, in broader terms, is that a 500-year storm will be much more intense and have a lower chance of occurring in a single year than a 10-year storm.
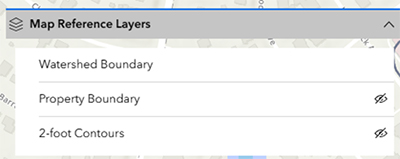
- Use the Map Reference Layers to add information to the map. This includes
- Watershed boundaries -This layer shows all the land area that drains to a stream (e.g. Sligo Creek).
- Parcel Boundaries – This layer shows the extent of county parcels.
- 2-foot Contours - This layer provides 2-foot topographic contours. These are only visible when the map is zoomed in.
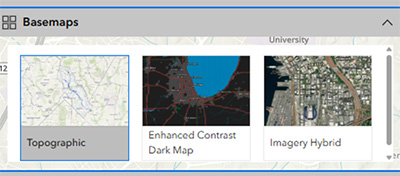
- Modify the Basemaps to view aerial or topographic basemap.
The topographic map will include road names, place names. The enhanced contrast dark map offers the same type of information but with higher contrast. The imagery hybrid provides aerial imagery along with road names.
- View symbology for reference layers displayed on the map using the Legend.
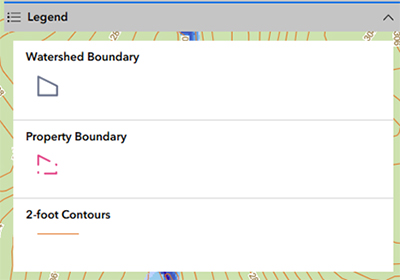
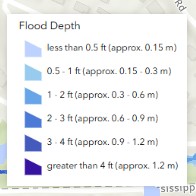
Flood Depths
The legend shows the colors representing the model flood depths. The colors indicate the depth of water modeled to occur at that location for the selected flood model scenario.
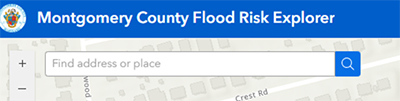
Address Search
Enter an address into the search bar and hit “Enter” or click magnifier icon.
Navigation Features
To navigate the map, do the following:
- To zoom, use Zoom in + and Zoom out - , the mouse and wheel button, or press Shift + Plus Sign (zoom in) and Shift + Minus Sign (zoom out) on the keyboard. To zoom in, you can also press the Shift key while dragging a box on the map.
- To zoom the map to its initial extent, click the house icon for the Default map view.
- To pan, use the mouse or the arrow keys on your keyboard.
- To rotate a map, right-click while dragging the pointer. Click Reset compass orientation (compass icon) to return the map view to north.
Contact Us
If you have questions about the Flood Risk Explorer, please contact us at [email protected] or call 311.