Projects and Products
CountyStat translates data into user-friendly and informative charts, graphs, infographics, and maps to help inform strategy, executive decisions, and frontline operations. The products below bring together administrative data, public data, and data from our network of partners to assist stakeholders in and out of government to make sense of issues that matter, understand where we are, and bring data-driven insights into discussions and decision making processes.
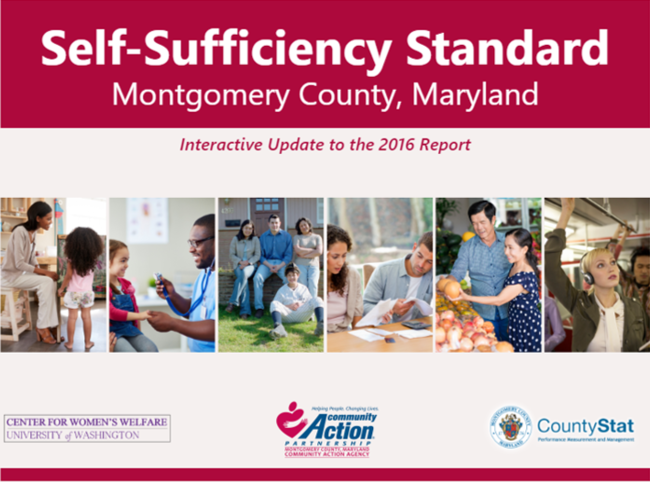
2023 Self-Sufficiency Standard
This interactive update to the 2023 Self-Sufficiency Standard was created by CountyStat in partnership with the Community Action Agency. It builds upon the Self-Sufficiency Standard created by the Center for Women's Welfare at the University of Washington.
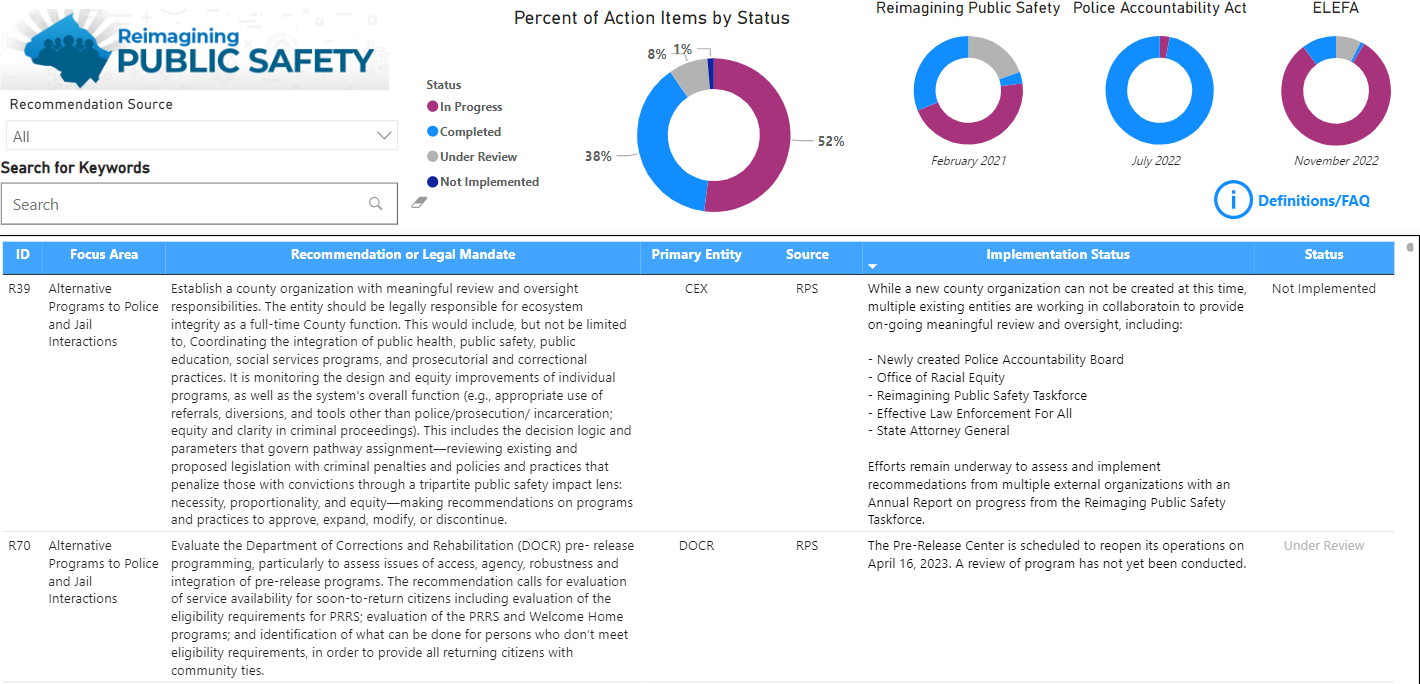
Reimagining Public Safety
This dashboard provides the public with data on the County's progress on the recommendations from the Reimagining Public Safety (RPS) Task Force, the Maryland Police Accountability Act, and the Effective Law Enforcement for All (ELE4A) Audit.
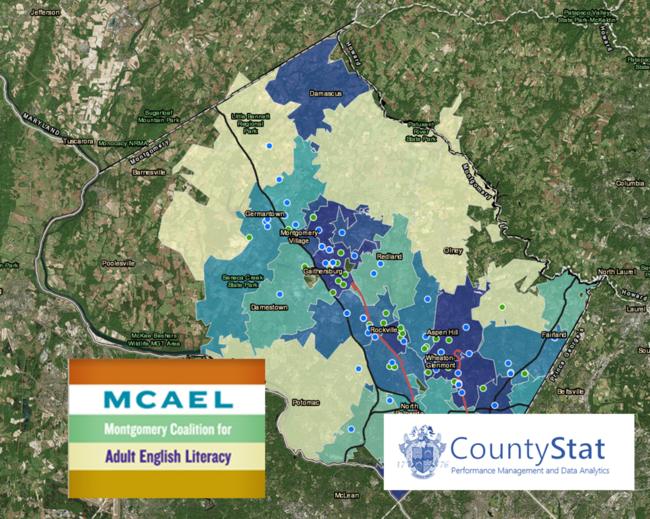
Adult English Literacy
Adult English education is a critical resource for County residents for whom English is not their native tongue. This product maps efforts to provide sufficient opportunities for literacy classes and identifies areas of growth.
Aging and Vulnerability Dashboards
CountyStat mapped and analyzed economic challenges facing our senior communities to help locate priority areas for aid. Click the image to explore the project.
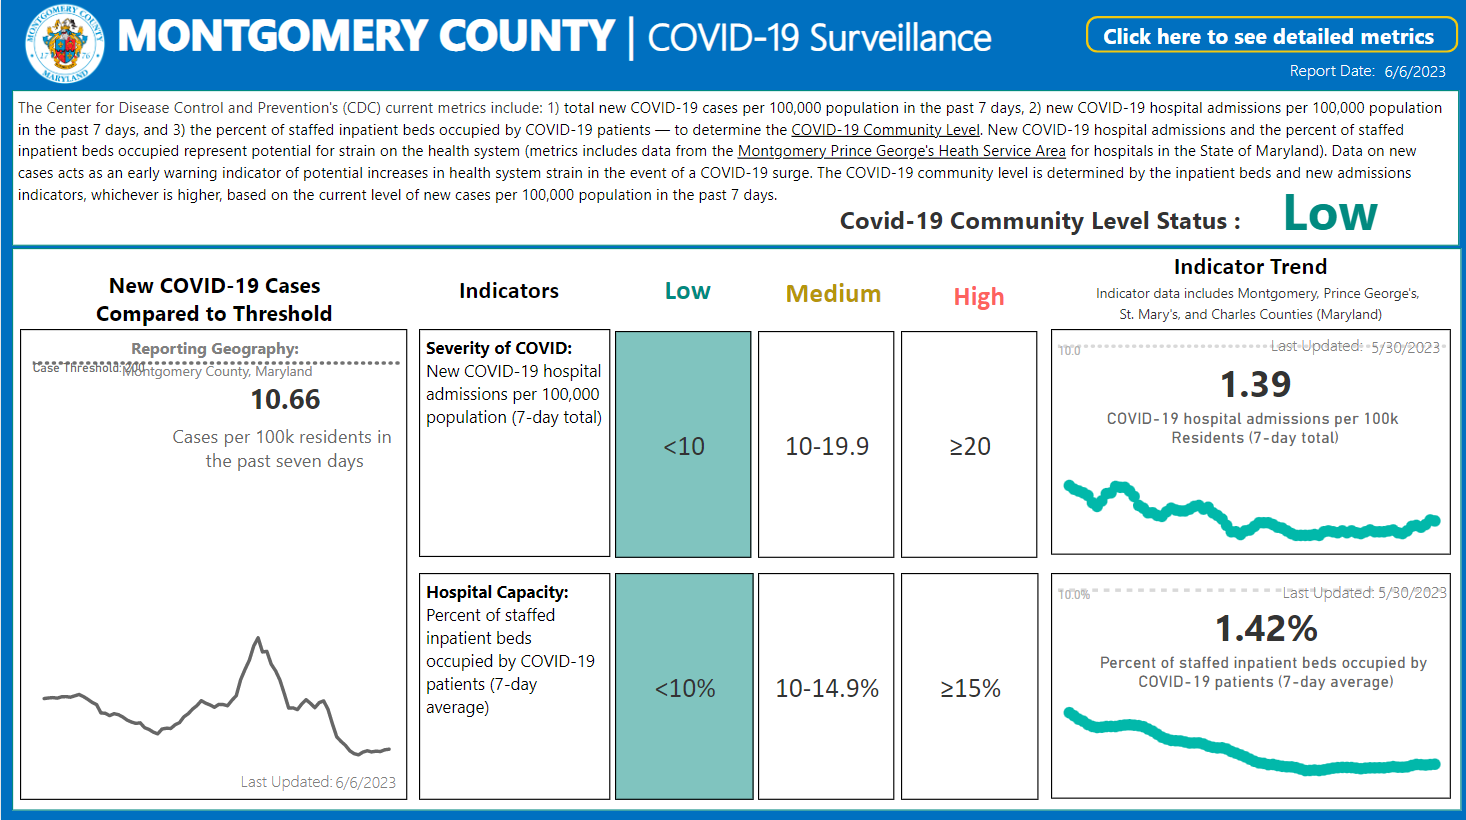
Covid-19 Surveillance
This dashboard displays the relevant metrics used to track the spread of Covid-19 in Montgomery County, Maryland.

Community Livibility Survey
Montgomery County conducted a Livability Survey to better understand resident views on quality of life in the County. Explore the results and see trends that point to positive progress and priorities for improvement.
MC Insights
This map-based data tool enables government staff and policymakers, residents, community partners, and advocates to explore the demographics and community assets located in Montgomery County to assist with planning and operations.


Vision Zero
Montgomery County was one of the first County governments to initiate a Vision Zero plan. The County is working to reduce severe and fatal collision on County roads by 35 percent for vehicle occupants, pedestrians, and bicyclists by 2019.
See visualizations of
- the study data
- current crash data provided by dataMontgomery
Food Security
CountyStat partnered with the Montgomery County Food Council and Montgomery County Department of Health and Human Services to develop an interactive data discovery tool to explore the data pertaining to the County’s Food Insecure residents and the efforts that our County and Community are taking in fighting hunger.
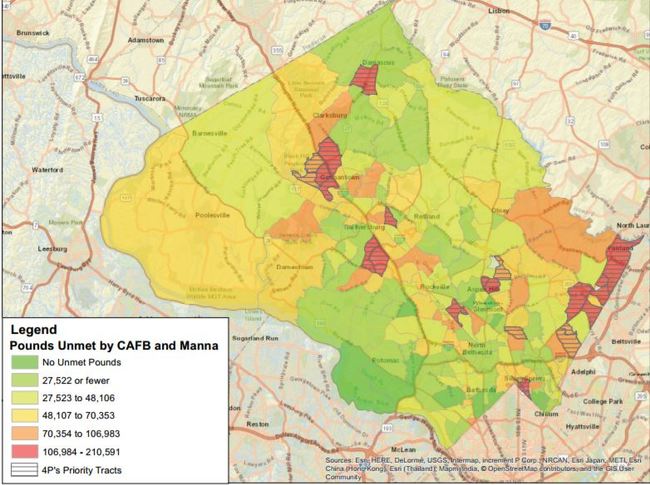
Food Security Analysis
The Montgomery County Food Security Plan is the blueprint for how every local business, nonprofit, government agency and resident can contribute to ensuring all County residents have access to sufficient and nutritious food.
Self-Sufficiency Standard
CountyStat partnered with the County’s Community Action Partnership to build an interactive dashboard to determine how much income a family of a certain composition in a given place needs to adequately meet their basic needs – without public or private assistance.
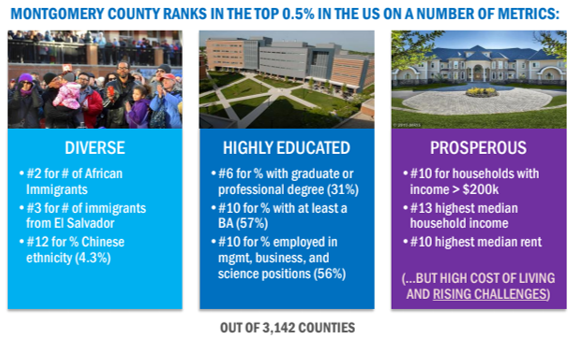
Hidden Hardships
Explores trends in the numbers and characteristics of those Montgomery County residents living in poverty. Click the image to explore interactive graphs and maps that show the complexity of economic hardship in our County.Montgomery County Public Schools Explorer
Explore Montgomery County Public School's data and trends that are present with the educational environment of the County's youth.
County Demographics
Explore some of the community analytics work that has informed the civic advisory boards throughout the County.
Housing Analytics
Explore the numbers behind the Montgomery County Maryland Housing Market.